• Skip to primary navigation
  • Skip to content
  • Skip to footer
Danny Tabach Data Scientist
  • About
  • Writing and Projects

    US Hospital Beds: Interactive Map

    less than 1 minute read

    An interactive map exploring hospital bed capacity across the United States.

    Tags: leaflet, r, shiny, visualization

    Categories: data-viz

    Updated: April 1, 2020

    Share on

    X Facebook LinkedIn Bluesky
    Previous Next

    You May Also Enjoy

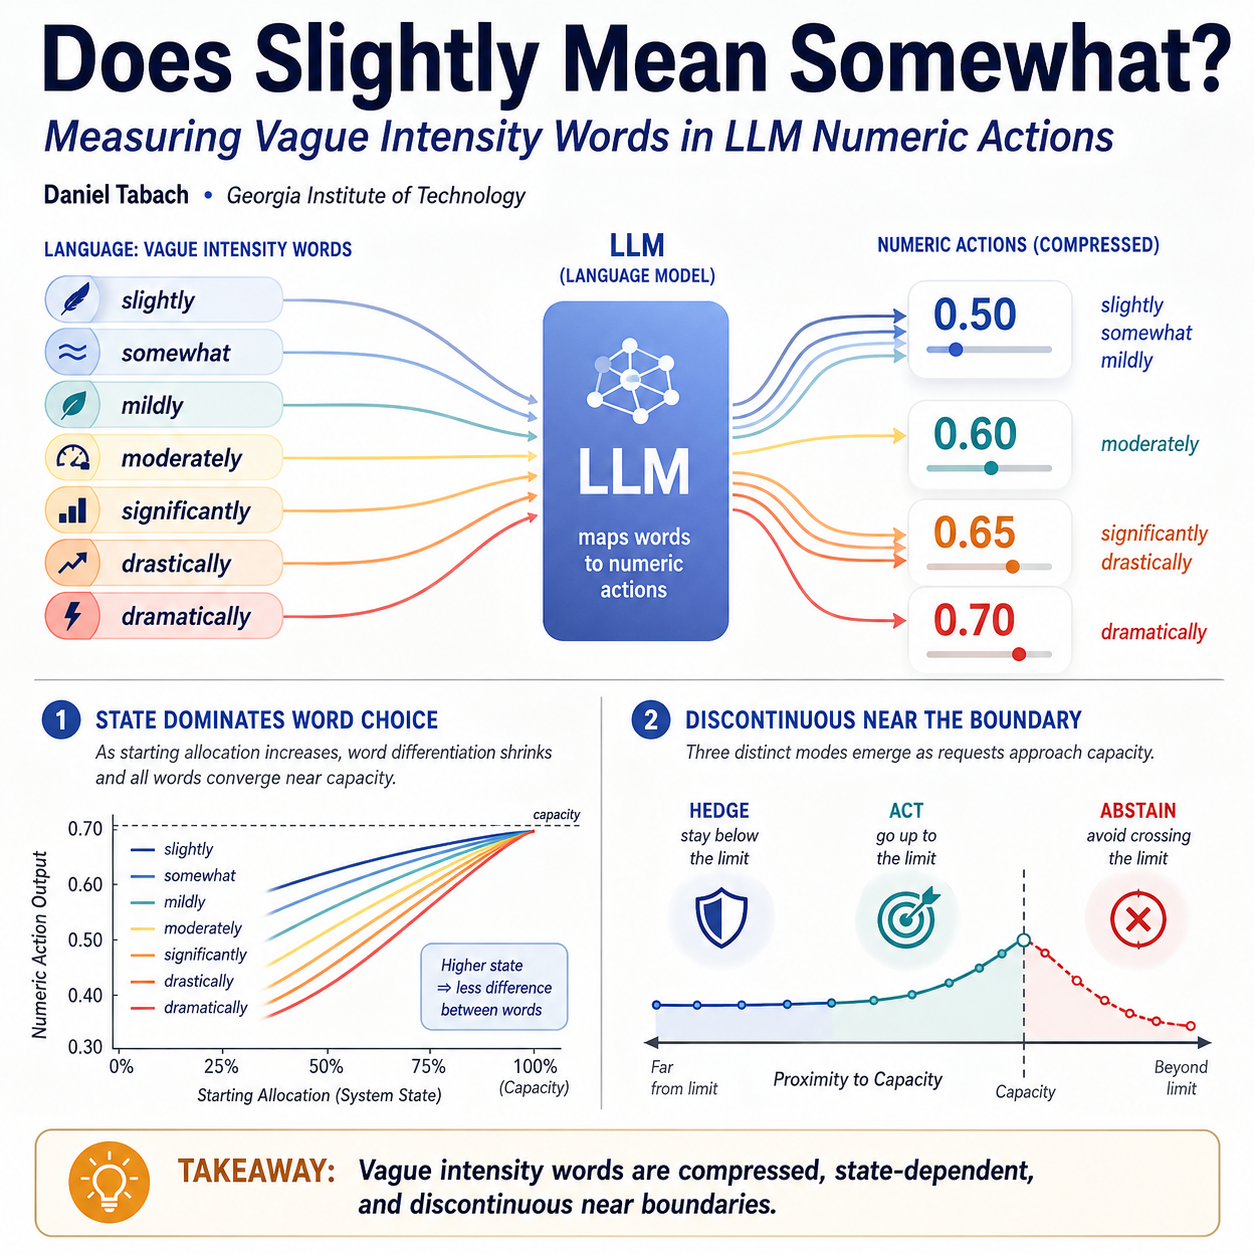
    Does Slightly Mean Somewhat? Measuring Vague Intensity Words in LLM Numeric Actions

    2 minute read

    Do language models preserve the ordinal meaning of intensity words when those words must produce numeric actions?

    Can Humans Detect AI? Mining Textual Signals of AI-Assisted Writing Under Varying Scrutiny Conditions

    2 minute read

    Does the threat of being caught change the way people use AI to write? And if it does, can other people tell the difference?

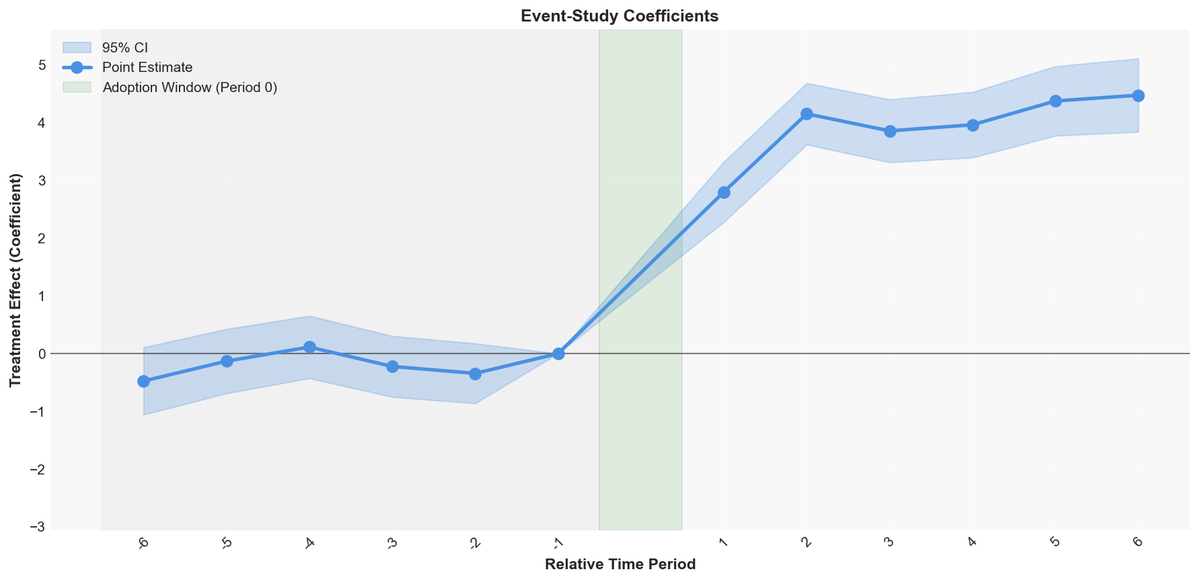
    When Treatment Timing Is Messy: Event-Study Design for Staggered Rollouts

    37 minute read

    You designed an experiment. Leadership signed off. The rollout took on a life of its own. Now what? Introduction All data in this post is simulated for d...

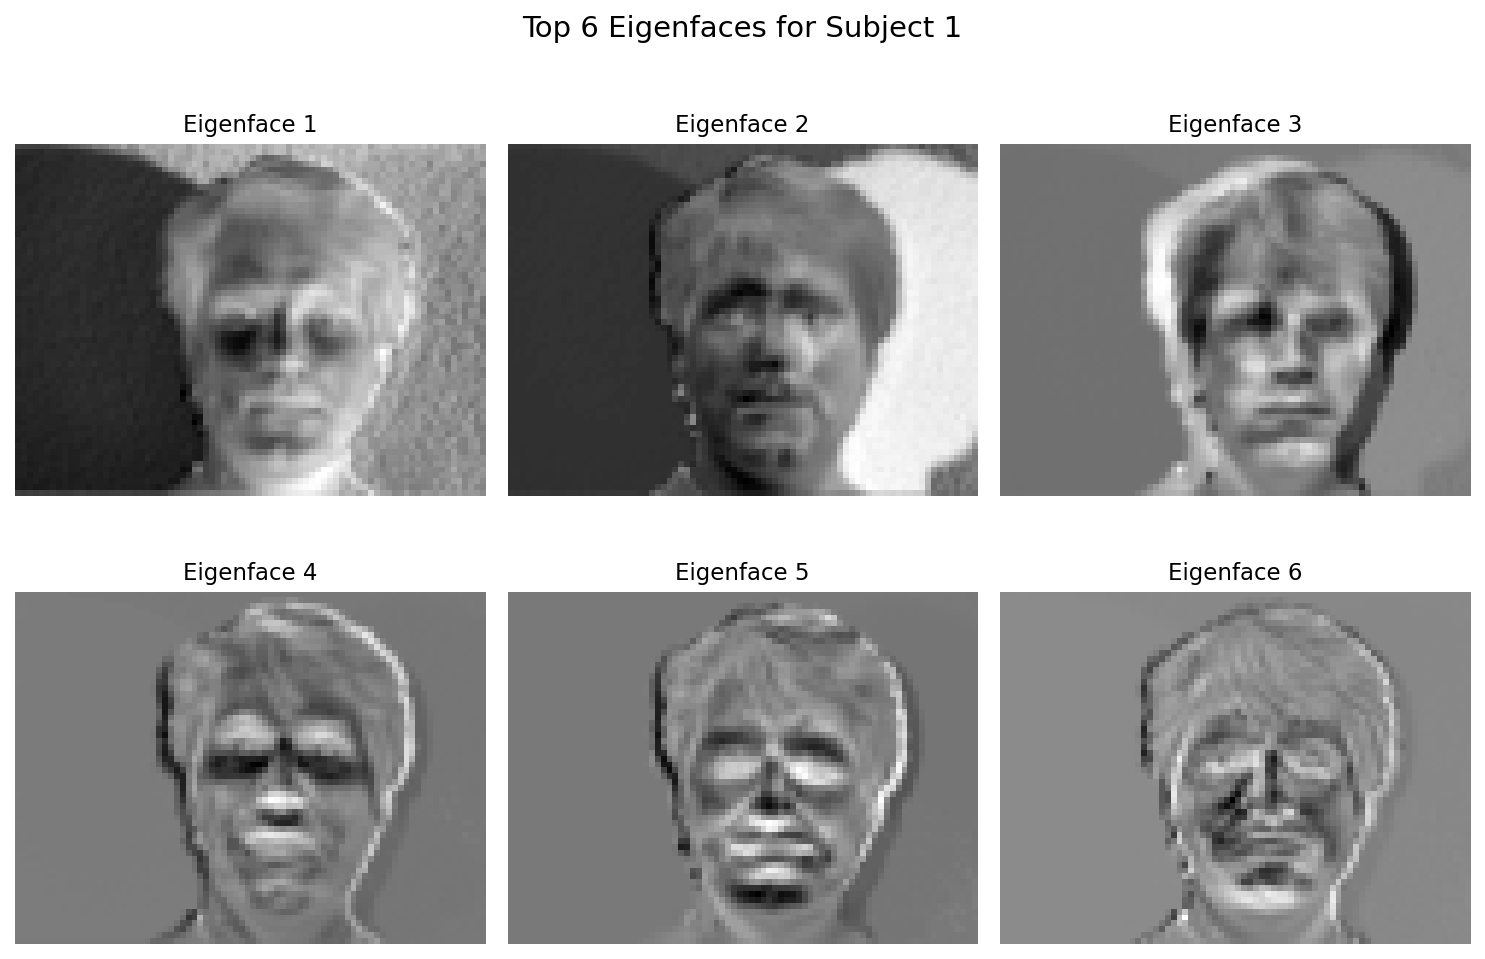
    Dimensionality Reduction From Scratch: PCA, ISOMAP, and Eigenfaces

    18 minute read

    You have thousands of features but only care about the patterns that matter. Here’s how to find them.

    • GitHub
    • LinkedIn
    • Feed
    © 2026 Danny Tabach. Powered by Jekyll & Minimal Mistakes.